Mastering OLAP Cube Reporting: Solving Grand Total Calculations in Snowflake Warehouse and AAS Cube Projects
Welcome to the first installment of our promised series of articles detailing the challenges we encountered and conquered during our work on the “Snowflake Warehouse and AAS Cube” project.
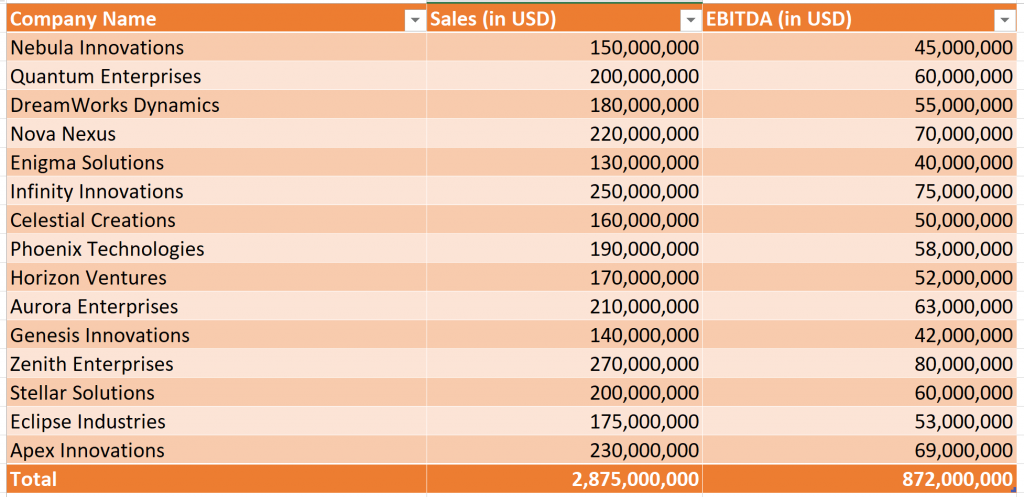
Today, we’re excited to share how we tackled a particularly thorny issue while developing an AAS Cube project for one of our valued clients. Our task involved creating measures to extract financial data such as Sales and EBITDA. Given that reports are generated in specific currencies (e.g., USD), we needed to incorporate currency (FX) conversions within these measures. The parameters for these calculations varied depending on the particular company, with each company having its base currency code.
Upon implementing all the necessary rules and commencing testing within an Excel pivot table, we encountered an unexpected hitch. While the individual company figures appeared accurate, the grand total row displayed incorrect values. Instead of reflecting the sum of the measure values for all rows based on applied filters and selections, it seemed to produce results unrelated to the listed companies.
Upon closer examination, we identified the root cause: the total row functioned as another call of the measure but with a different context. It executed the same measure expression across all companies simultaneously, resulting in unexpected outcomes as all fields and calculations in the DAX expression were evaluated for ALL selected companies together.
To remedy this issue, we employed a combination of the SUMX() and VALUES() functions. For instance, the DAX expression for the Sales measure would appear as follows:
Sales := SUMX(
VALUES(D_COMPANY_TABLE[COMPANY_KEY_COLUMN]),
SUMX(F_COMPANY_FINANCIALS,
F_COMPANY_FINANCIALS, [ACTUAL_SALES] * [Currency Rate])
)
Here’s a breakdown of the components:
- D_COMPANY_TABLE[COMPANY_KEY_COLUMN]: This refers to a dimensions table containing the list of companies.
- F_COMPANY_FINANCIALS: Represents the fact table containing details about each company’s financials.
- ACTUAL_SALES: Denotes a field from F_COMPANY_FINANCIALS containing the company’s sales data.
- [Currency Rate]: This is a measure returning the currency rate for each company’s currency during iterations.
The SUMX() function serves as an iterator, summing up the expression passed as the second argument (i.e., the “original” expression of our measure) evaluated for each row in the table passed as the first argument.
Meanwhile, the VALUES() function generates a one-column table containing distinct values from the provided table. In our case, it yields the unique company keys (IDs) selected in the report.
As a result of this approach, our original calculation is evaluated for each company, and the resulting figures are then summed across all companies.
This method ensures that when executed within the context of each row (e.g., one company), it yields the same result as our original measure. However, when executed within the context of the total row encompassing multiple companies, it produces the expected results, aligning with the sum of measure values from all rows across the Excel/Power BI table.
We trust that this insight will assist you in deriving accurate totals from your OLAP cube. Should you require assistance with similar projects, we are at your service!
 0
0 0
0 0
0 0
0 0
0